Market Outlook
December 08, 2017
Market Cues
Domestic Indices
Chg (%)
(Pts)
(Close)
Indian markets are likely to open flat tracking global indices and SGX Nifty.
BSE Sensex
1.1
352
32,949
The U.S. stock benchmarks closed moderately higher Thursday, with the S&P 500
Nifty
1.2
123
10,167
snapping a four-session losing streak on the back of gains in the technology, while
Mid Cap
1.4
231
16,894
General Electric co powering the Dow Jones to strong gains. Traders focused on
Small Cap
1.3
230
18,031
continued progress on tax legislation and looked ahead to the monthly jobs report
Bankex
1.0
277
28,388
due Friday. The S&P 500 gained 0.3%, to finish at 2,637, while the Dow added
0.3%, to close at 24,211, while NASDAQ outpaced the other benchmarks and was
up 0.5%, to end at 6,813.
Global Indices
Chg (%)
(Pts)
(Close)
Dow Jones
0.3
71
24,211
The FTSE 100 dropped 0.4% lower at 7,321, primarily driven by a stronger pound
on hopes Prime Minister Theresa ay will meet a Sunday deadline of presenting a
Nasdaq
0.5
36
6,813
Brexit deal to the European Union.
FTSE
(0.4)
(27)
7,321
Nikkei
1.2
261
22,759
ON domestic front, indices rose sharply on Thursday as firm global cues and a
sharp fall in oil prices overnight spurred investors to go bargain hunting after last
Hang Seng
0.5
130
28,433
week's heavy losses. The BSE Sensex jumped 1.08% to finish at 32,950; the Nifty
Shanghai Com
0.1
4
3,276
index jumped 1.22% to finish at 10,167.
Advances / Declines
BSE
NSE
News Analysis
Advances
1,865
1,273
Emami acquires 30% stake in Helios Lifestyle
Declines
837
473
Detailed analysis on Pg2
Unchanged
152
60
Investor’s Ready Reckoner
Volumes (` Cr)
Key Domestic & Global Indicators
BSE
3,898
Stock Watch: Latest investment recommendations on 150+ stocks
Refer Pg5 onwards
NSE
27,198
Top Picks
Net Inflows (` Cr)
Net
Mtd
Ytd
CMP
Target
Upside
Company
Sector
Rating
(`)
(`)
(%)
FII
(1,124)
(2,523)
55,109
Blue Star
Capital Goods Accumulate
786
867
10.3
MFs
300
10,669 1,06,079
Dewan Housing Finance
Financials
Buy
602
712
18.3
Asian Granito
Other
Buy
496
570
15.0
Top Gainers
Price (`)
Chg (%)
Navkar Corporation
Other
Buy
184
265
44.3
KEI Industries
Capital Goods Accumulate
395
425
7.6
Kec
344
9.8
More Top Picks on Pg4
Rtnpower
9
8.8
Gail
493
8.0
Key Upcoming Events
Tv18Brdcst
56
6.6
Previous
Consensus
Date
Region
Event Description
Reading
Expectations
Canfinhome
486
6.2
Dec08
UK
Industrial Production (YoY)
2.50
Dec08
India
Imports YoY%
7.60
Top Losers
Price (`)
Chg (%)
Dec08
India
Exports YoY%
(1.10)
Dec08
China
Exports YoY%
6.90
Jublfood
1,651
(3.4)
Dec08
US
Change in Nonfarm payrolls
261.00
198.00
Piind
940
(2.7)
More Events on Pg7
Irb
205
(2.3)
Infibeam
161
(2.0)
Carerating
1,340
(1.7)
As on December 07 2017
Market Outlook
December 08, 2017
News Analysis
Emami acquires 30% stake in Helios Lifestyle
The Emami Ltd has acquired 30% stake in Helios Lifestyle Ltd, which owns the
premium male grooming brand ‘The Man Company’.
While Emami did not disclose the amount of investment, the equity stake will be
acquired by December 31, 2018. Emami is present in the ₹5,000-crore male
grooming segment through its brands Fair and Handsome and HE.
Management said “This investment is in line with the company’s strategy of
leveraging online opportunities brought about by rapid digitalisation which is the
future and will also help us to be present in the premium end of growing male
grooming segment,”.
Economic and Political News
Taxman may invoke Benami Act for unexplained credits, investments
FinMin allays depositors’ fears on bank ‘bail-in’ provision
Call to raise insured amount on bank deposits to ₹10 lakh
Corporate News
GAIL awards contracts for laying 520 km pipelines from Dobhi to Durgapur
Union Bank QIP opens at a floor price of `162.79 per share
TVS Motor bought 14.8 percent stake in electric two-wheeler company
Ultraviolette.
Tube Investments to acquire controlling stake in Creative Cycles & Great
Market Outlook
December 08, 2017
Top Picks HHHHH
Market Cap
CMP
Target
Upside
Company
Rationale
(` Cr)
(`)
(`)
(%)
Strong growth in domestic business due to its leade`hip
in acute therapeutic segment. Alkem expects to launch
Alkem Laboratories
25,999
2,175
2,287
5.2
more products in USA, which bodes for its international
business.
We expect the company would report strong profitability
Asian Granito
1,491
496
570
15.0
owing to better product mix, higher B2C sales and
amalgamation synergy.
Favorable outlook for the AC industry to augur well for
Cooling products business which is out pacing the
Blue Star
7,535
786
867
10.3
market growth. EMPPAC division's profitability to
improve once operating environment turns around.
With a focus on the low and medium income (LMI)
consumer segment, the company has increased its
Dewan Housing Finance
18,874
602
712
18.3
presence in tier-II & III cities where the growth
opportunity is immense.
Loan growth is likely to pick up after a sluggish FY17.
Lower credit cost will help in strong bottom-line growth.
Karur Vysya Bank
8,169
113
180
59.0
Increasing share of CASA will help in NIM
improvement.
High order book execution in EPC segment, rising B2C
KEI Industries
3,096
395
425
7.6
sales and higher exports to boost the revenues and
profitability
Expected to benefit from the lower capex requirement
Music Broadcast
2,262
397
434
9.5
and 15 year long radio broadcast licensing.
Massive capacity expansion along with rail advantage
Navkar Corporation
2,765
184
265
44.3
at ICD as well CFS augur well for the company
Strong brands and distribution network would boost
Siyaram Silk Mills
3,323
709
721
5.0
growth going ahead. Stock currently trades at an
inexpensive valuation.
Market leadership in Hindi news genre and no.
2
viewership ranking in English news genre, exit from the
TV Today Network
2,452
411
435
5.8
radio business, and anticipated growth in ad spends by
corporate to benefit the stock.
After GST, the company is expected to see higher
volumes along with improving product mix. The Gujarat
Maruti Suzuki
2,68,280
8,881
9,489
6.8
plant will also enable higher operating leverage which
will be margin accretive.
We expect loan book to grow at 24.3% over next two
GIC Housing
2,245
417
655
57.1
year; change in borrowing mix will help in NIM
improvement
We expect CPIL to report net Revenue/PAT CAGR of
~17%/16% over FY2017-20E mainly due to healthy
7,034
317
400
26.3
growth in plywood & lamination business, forayed into
Century Plyboards India
MDF & Particle boards on back of strong brand &
distribution network.
We expect sales/PAT to grow at 13.5%/20% over next
LT Foods
2,249
84
96
13.9
two years on the back of strong distribution network &
addition of new products in portfolio.
Source: Company, Angel Research
Market Outlook
December 08, 2017
Key Upcoming Events
Global economic events release calendar
Bl oomberg Data
D ate
Time
C ountry
Event Description
Unit
Period
L ast Reporte d
E stimate d
Dec 08, 2017
3:00 PM UK
Industrial Production (YoY)
% Change
Oct
2.50
India
Imports YoY%
% Change
Nov
7.60
India
Exports YoY%
% Change
Nov
(1.10)
China
Exports YoY%
% Change
Nov
6.90
7:00 PM US
Change in N onfarm payrolls
Thousands
Nov
261.00
198.00
7:00 AM China
Consumer Price Index (YoY)
% Change
Nov
1.90
1.80
Dec 09, 2017
7:00 PM US
Unnemployment rate
%
Nov
4.10
4.10
Dec 12, 2017
5:30 PM India
Industrial Production YoY
% Change
Oct
3.80
3:00 PM UK
CPI (YoY)
% Change
Nov
3.00
US
Producer Price Index (mom)
% Change
Nov
0.20
Dec 13, 2017
3:00 PM UK
Joble ss claims change
% Change
Nov
1.10
7:00 PM US
Consumer price index (mom)
% Change
Nov
0.10
0.40
Dec 14, 2017
7:30 AM China
Industrial Production (YoY)
% Change
Nov
6.20
12: 00 PM India
Monthly Wholesale Prices YoY%
% Change
Nov
3.59
5:30 PM UK
BOE Announce s rate s
% Ratio
Dec 14
0.50
0.50
6:15 PM Euro Zone
ECB announces interest rates
%
Dec 14
-
7:45 PM US
Industrial Production
%
Nov
0.94
Dec 15, 2017
3:30 PM Euro Zone
Euro-Zone CPI (YoY)
%
Nov F
1.40
Dec 18, 2017
12: 30 AM US
FOMC rate decision
%
Dec 13
1.25
1.50
Dec 19, 2017
7:00 PM US
Housi ng Starts
Thousands
Nov
1,290.00
7:00 PM US
Building permits
Thousands
Nov
1,316.00
Dec 20, 2017
8:30 PM US
Existing home sales
Million
Nov
5.48
Dec 22, 2017
8:30 PM US
New home sales
Thousands
Nov
685.00
3:00 PM UK
GDP (YoY)
% Change
3Q F
1.50
Source: Bloomberg, Angel Research
Market Outlook
December 08, 2017
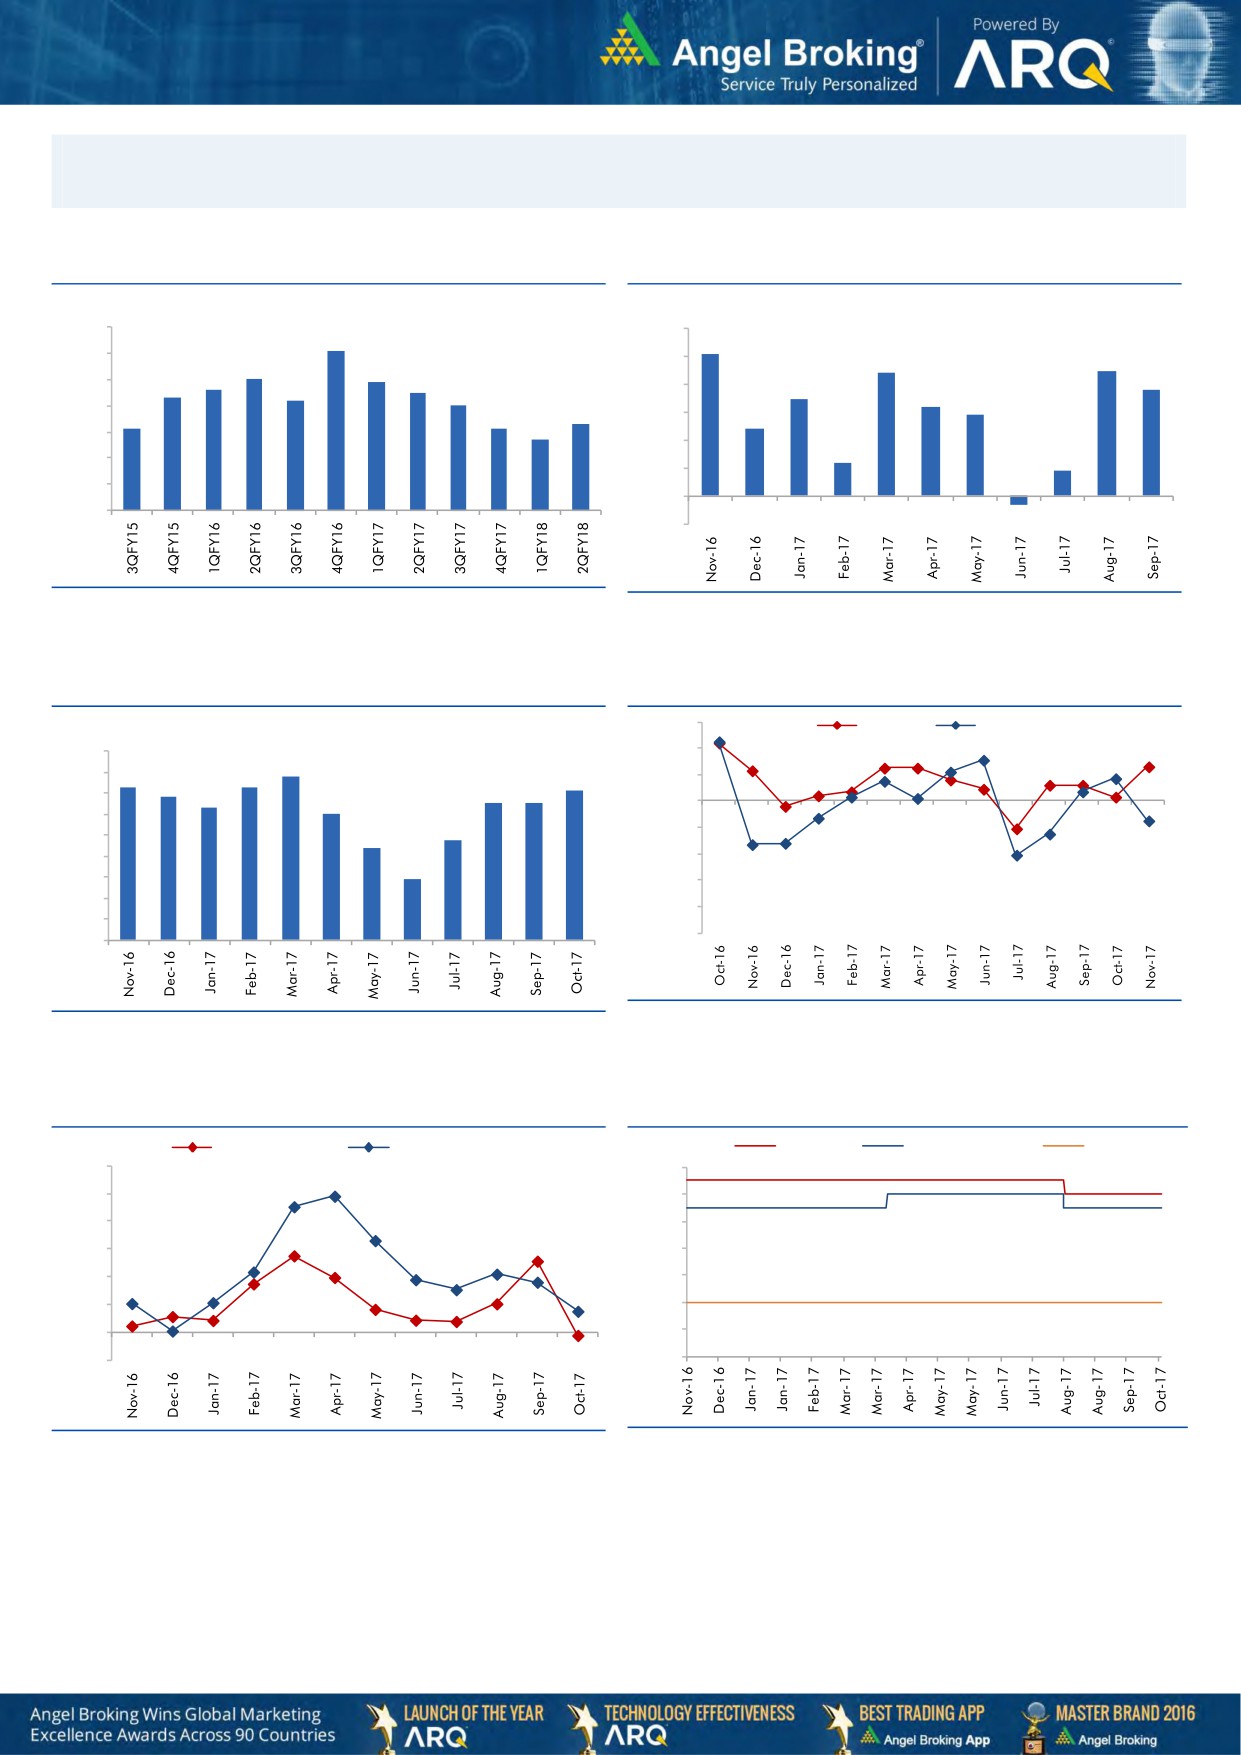
Macro watch
Exhibit 1: Quarterly GDP trends
Exhibit 2: IIP trends
(%)
(%)
10.0
6.0
9.1
5.1
9.0
5.0
4.4
4.5
8.0
7.9
7.6
7.5
3.8
8.0
7.3
7.2
4.0
3.5
7.0
3.2
2.9
7.0
6.3
6.1
6.1
3.0
2.4
5.7
6.0
2.0
1.2
5.0
0.9
1.0
4.0
-
3.0
(1.0)
(0.3)
Source: CSO, Angel Research
Source: MOSPI, Angel Research
Exhibit 3: Monthly CPI inflation trends
Exhibit 4: Manufacturing and services PMI
56.0
Mfg. PMI
Services PMI
(%)
4.5
54.0
3.9
4.0
3.6
3.7
3.6
52.0
3.4
3.2
3.3
3.3
3.5
3.0
50.0
3.0
2.4
48.0
2.5
2.2
2.0
46.0
1.5
1.5
44.0
1.0
42.0
0.5
40.0
-
Source: Market, Angel Research; Note: Level above 50 indicates expansion
Source: MOSPI, Angel Research
Exhibit 5: Exports and imports growth trends
Exhibit 6: Key policy rates
(%)
Exports yoy growth
Imports yoy growth
(%)
Repo rate
Reverse Repo rate
CRR
60.0
6.50
50.0
6.00
40.0
5.50
30.0
5.00
20.0
4.50
10.0
4.00
0.0
3.50
(10.0)
3.00
Source: Bloomberg, Angel Research
Source: RBI, Angel Research
Market Outlook
December 08, 2017
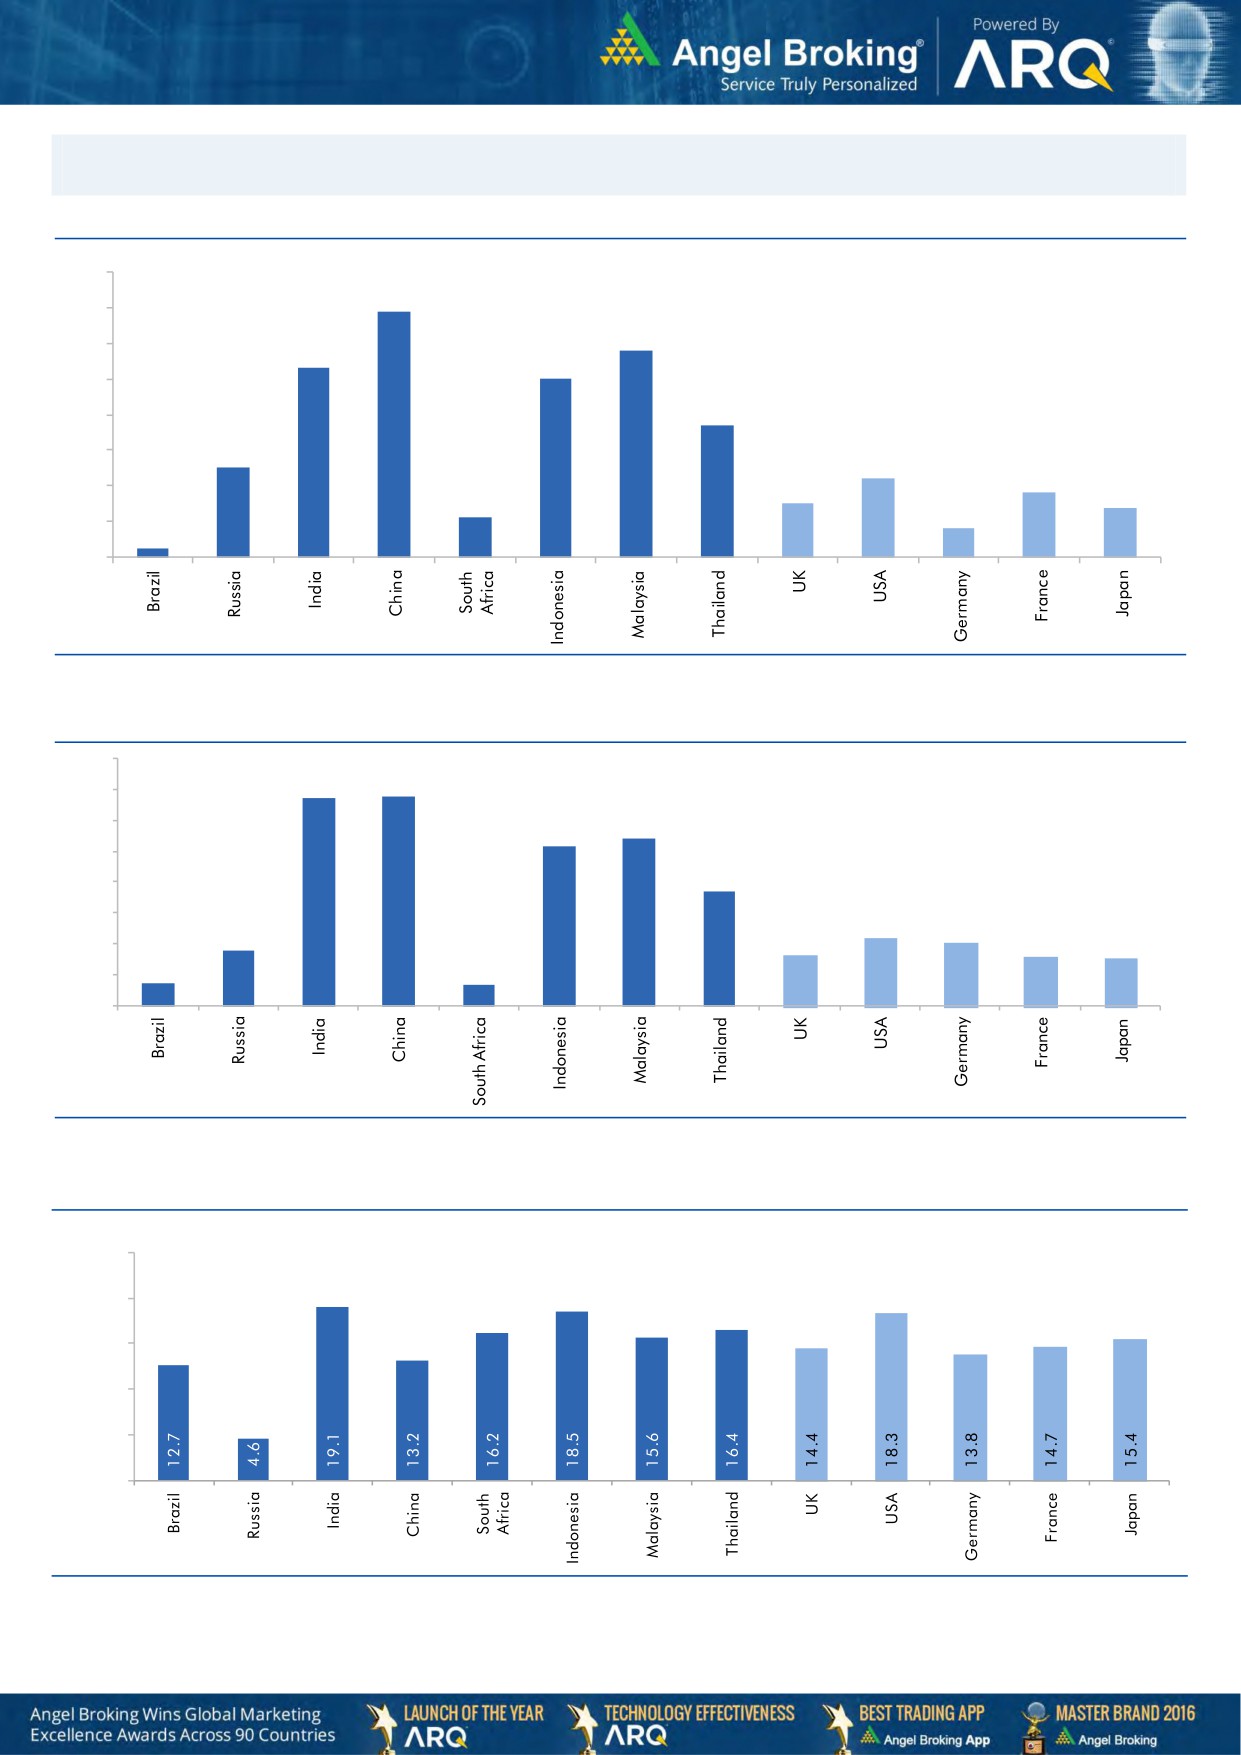
Global watch
Exhibit 1: Latest quarterly GDP Growth (%, yoy) across select developing and developed countries
(%)
8.0
6.9
7.0
5.8
6.0
5.3
5.0
5.0
1.1
3.7
4.0
2.5
3.0
2.2
1.8
2.0
1.5
1.4
0.8
1.0
0.3
-
Source: Bloomberg, Angel Research
Exhibit 2: 2017 GDP Growth projection by IMF (%, yoy) across select developing and developed countries
(%)
6.7
6.8
7.0
6.0
5.4
5.2
5.0
3.7
4.0
3.0
1.8
2.2
2.0
1.7
1.6
2.0
0.7
1.5
0.7
1.0
-
Source: IMF, Angel Research
Exhibit 3: One year forward P-E ratio across select developing and developed countries
(x)
25.0
20.0
15.0
10.0
5.0
-
Source: IMF, Angel Research
Market Outlook
December 08, 2017
Exhibit 4: Relative performance of indices across globe
Returns (%)
C ountry
Name of index
Closing price
1M
3M
1YR
Brazil
Bovespa
72,487
(1.9)
0.8
20.2
Russia
Micex
2,103
(2.4)
4.6
(4.8)
India
Nifty
10,167
(1.8)
2.5
24.8
China
Shanghai Composite
3,272
(4.1)
(3.1)
0.8
South Africa
Top 40
51,657
(4.0)
4.5
19.6
Mexico
Mexbol
46,987
(4.0)
(7.0)
0.2
Indonesia
LQ45
1,013
0.8
4.9
16.9
Malaysia
KLCI
1,719
(1.3)
(2.9)
5.5
Thailand
SET 50
1,098
1.1
6.2
17.5
USA
Dow Jones
24,211
2.8
11.1
23.4
UK
FTSE
7,321
(2.6)
(0.8)
5.3
Japan
Nikkei
22,498
(0.2)
15.3
21.5
Germany
DAX
13,045
(2.5)
6.8
16.6
France
CAC
5,384
(1.8)
5.3
11.7
Source: Bloomberg, Angel Research p68in4
Stock Watch
December 08, 2017
Company Name
Reco
CMP
Target
Mkt Cap
Sales ( Čcr )
OPM(%)
EPS (Č)
PER(x)
P/BV(x)
RoE(%)
EV/Sales(x)
(Č)
Price ( Č)
( Č cr )
FY18E FY19E
FY18E
FY19E
FY18E
FY19E
FY18E
FY19E
FY18E
FY19E
FY18E
FY19E
FY18E
FY19E
Agri / Agri Chemical
Rallis
Reduce
236
209
4,589
1,873
2,099
15.0
15.0
9.5
10.5
24.8
22.5
3.8
3.4
15.8
16.0
2.3
2.1
United Phosphorus
Accumulate
722
820
36,726
18,922
21,949
18.0
18.5
36.2
45.6
20.0
15.8
4.2
3.5
22.7
23.8
2.1
1.8
Auto & Auto Ancillary
Ashok Leyland
Accumulate
117
127
34,218
23,339
27,240
10.1
10.8
4.7
6.2
25.2
18.8
5.0
4.4
20.0
23.6
1.4
1.2
Bajaj Auto
Neutral
3,196
-
92,477
23,936
27,955
19.5
20.1
142.7
167.3
22.4
19.1
4.9
4.4
21.8
22.8
3.5
2.9
Bharat Forge
Buy
703
875
32,740
7,637
8,755
21.7
23.2
36.1
47.3
19.5
14.9
3.5
3.0
18.5
20.8
4.1
3.5
Eicher Motors
Neutral
28,811
-
78,430
19,043
22,837
19.5
19.9
835.4
1,019.0
34.5
28.3
12.9
9.9
40.9
37.8
4.0
3.3
Gabriel India
Neutral
187
-
2,679
1,782
2,033
9.7
10.2
7.1
8.9
26.3
21.1
5.3
4.5
21.0
22.2
1.5
1.3
Hero Motocorp
Buy
3,555
4,129
71,004
32,239
36,878
16.0
15.6
184.4
206.5
19.3
17.2
6.1
5.3
31.3
30.7
2.0
1.7
Jamna Auto Industries Neutral
65
-
2,590
1,441
1,662
14.4
14.8
13.9
17.6
4.7
3.7
1.3
1.0
30.0
31.0
1.8
1.5
Mahindra and Mahindra Neutral
1,381
-
85,842
46,971
53,816
13.6
14.0
67.7
79.8
20.4
17.3
2.9
2.6
15.0
15.9
1.7
1.4
Maruti
Accumulate
8,881
9,489
268,280
79,470
95,208
15.9
17.2
281.7
363.8
31.5
24.4
6.9
5.6
21.7
22.8
3.0
2.5
Minda Industries
Neutral
1,122
-
9,698
4,328
5,084
11.0
11.9
27.3
36.4
41.2
30.8
8.7
6.8
23.1
25.6
2.3
2.0
Motherson Sumi
Neutral
365
-
76,849
55,937
64,445
10.8
11.4
16.9
21.1
21.6
17.3
4.8
4.9
25.2
25.4
1.4
1.2
Tata Motors
Neutral
402
-
116,115
303,167
343,649
11.8
13.8
33.1
54.7
12.2
7.4
2.0
1.6
16.9
23.0
0.4
0.4
TVS Motor
Neutral
749
-
35,575
13,992
16,216
9.0
9.4
17.1
20.3
43.9
36.9
11.7
9.0
29.7
27.7
2.5
2.1
Amara Raja Batteries
Accumulate
768
858
13,112
6,140
7,122
14.3
15.6
29.3
39.0
26.2
19.7
4.5
3.8
17.1
19.0
2.1
1.8
Exide Industries
Neutral
202
-
17,179
8,689
9,854
15.1
15.2
9.7
11.0
20.9
18.4
3.7
3.3
15.7
16.1
1.7
1.5
Apollo Tyres
Neutral
243
-
13,884
15,739
17,326
13.3
14.6
20.4
26.7
11.9
9.1
1.4
1.3
20.4
26.7
1.1
1.0
Ceat
Neutral
1,723
-
6,969
6,661
7,717
11.1
14.2
116.2
178.2
14.8
9.7
2.6
2.1
15.2
21.3
1.2
1.0
JK Tyres
Neutral
138
-
3,135
8,318
9,239
16.2
16.4
21.0
27.5
6.6
5.0
1.3
1.0
19.1
20.4
0.8
0.7
Swaraj Engines
Neutral
1,948
-
2,420
788
889
16.4
16.5
71.6
81.0
27.2
24.1
7.8
7.3
29.6
31.0
2.7
2.4
Subros
Neutral
254
-
1,526
1,855
2,135
11.6
11.8
10.3
14.7
24.8
17.4
3.8
3.2
15.8
19.1
1.0
0.9
Capital Goods
BEML
Neutral
1,573
-
6,552
4,286
5,194
7.1
8.2
42.9
58.1
36.7
27.1
3.0
2.7
7.6
8.7
1.6
1.3
Bharat Electronics
Neutral
183
-
45,037
10,258
12,470
19.6
19.5
7.3
8.6
25.1
21.3
0.5
0.4
20.4
21.9
3.9
3.2
Voltas
Neutral
618
-
20,450
6,778
8,004
9.6
11.0
17.1
22.4
36.1
27.6
8.6
7.6
17.7
19.8
2.7
2.3
BHEL
Neutral
92
-
33,667
33,200
39,167
6.8
9.5
6.2
11.2
14.8
8.2
0.7
0.7
4.6
8.0
0.6
0.4
Blue Star
Accumulate
786
867
7,535
5,220
6,207
6.3
6.6
16.8
22.3
46.8
35.3
9.3
8.2
19.9
23.3
1.4
1.2
CG Power and Industrial
Neutral
84
-
5,290
6,555
7,292
7.5
7.5
-
0.8
8,440.0
105.5
1.3
1.3
0.1
1.2
0.9
0.8
Solutions
Greaves Cotton
Neutral
120
-
2,939
1,778
1,993
14.7
15.1
8.1
9.1
14.9
13.2
3.3
3.1
21.8
23.6
1.4
1.3
Stock Watch
December 08, 2017
Company Name
Reco
CMP
Target
Mkt Cap
Sales ( Čcr )
OPM(%)
EPS (Č)
PER(x)
P/BV(x)
RoE(%)
EV/Sales(x)
(Č)
Price ( Č)
( Č cr )
FY18E FY19E
FY18E
FY19E
FY18E
FY19E
FY18E
FY19E
FY18E
FY19E
FY18E
FY19E
FY18E
FY19E
Capital Goods
KEC International
Neutral
344
-
8,836
9,779
11,113
9.4
9.8
14.2
18.2
24.2
18.9
4.6
3.8
21.1
22.1
1.2
1.0
KEI Industries
Accumulate
395
425
3,096
3,001
3,391
10.0
10.0
13.0
16.1
30.4
24.5
5.5
4.6
18.2
18.7
1.2
1.1
Thermax
Neutral
1,115
-
13,288
4,125
4,747
10.3
10.8
26.7
31.5
41.8
35.4
4.7
4.3
11.2
12.0
3.0
2.6
VATech Wabag
Accumulate
606
681
3,309
3,867
4,126
9.6
10.0
34.9
39.8
17.4
15.2
2.9
2.5
17.7
17.5
0.9
0.8
Cement
ACC
Neutral
1,704
-
31,991
12,255
13,350
13.5
14.3
58.0
66.2
29.4
25.7
3.5
3.2
11.5
12.2
2.6
2.4
Ambuja Cements
Neutral
266
-
52,759
10,250
11,450
17.5
19.0
7.2
8.3
36.9
32.0
2.6
2.5
7.0
7.8
4.9
4.3
India Cements
Neutral
167
-
5,155
6,135
6,750
14.8
15.2
8.5
11.5
19.7
14.6
1.0
0.9
4.8
6.2
1.2
1.0
JK Cement
Neutral
998
-
6,975
4,150
4,775
19.2
20.0
49.0
63.5
20.4
15.7
3.2
2.8
17.0
18.5
2.1
1.8
J K Lakshmi Cement
Neutral
410
-
4,827
3,422
3,757
15.5
17.0
13.5
23.2
30.4
17.7
3.2
2.7
10.8
15.5
1.8
1.6
Orient Cement
Neutral
165
-
3,381
2,215
3,233
16.8
17.0
5.9
6.9
28.0
23.9
2.1
2.0
10.8
10.1
2.5
1.7
UltraTech Cement
Neutral
4,086
-
112,172
28,250
35,150
20.2
23.5
77.5
122.2
52.7
33.4
4.4
4.0
9.6
14.8
4.4
3.6
Construction
KNR Constructions
Neutral
282
-
3,958
1,846
2,203
14.5
14.5
12.1
13.7
23.3
20.6
1.3
1.1
17.5
16.7
2.2
1.8
Larsen & Toubro
Neutral
1,219
-
170,807
95,787
109,476
10.2
11.6
44.5
50.8
27.4
24.0
3.4
3.2
12.9
13.1
2.3
2.1
Gujarat Pipavav Port
Neutral
139
-
6,713
739
842
61.6
62.7
5.1
6.2
27.2
22.6
3.4
3.3
12.7
14.9
8.5
7.4
PNC Infratech
Neutral
187
-
4,790
2,040
2,935
13.0
13.0
6.4
9.0
29.2
20.7
0.8
0.7
9.7
12.2
2.3
1.7
Simplex Infra
Neutral
581
-
2,874
6,012
6,619
11.6
11.7
21.1
31.0
27.6
18.8
1.9
1.8
6.5
8.6
1.0
0.9
Sadbhav Engineering
Neutral
370
-
6,343
3,823
4,426
10.7
10.8
10.3
11.8
35.9
31.3
4.3
3.8
10.1
10.5
2.0
1.7
NBCC
Neutral
255
-
22,910
9,099
12,706
6.4
6.4
7.3
9.6
35.0
26.6
1.5
1.2
27.5
30.5
2.4
1.7
MEP Infra
Neutral
94
-
1,526
2,403
2,910
18.3
16.8
2.4
6.1
39.9
15.5
15.1
10.2
35.2
55.8
1.8
1.5
SIPL
Neutral
133
-
4,695
2,060
2,390
46.8
47.7
(5.8)
(3.1)
5.0
5.7
(14.2)
(2.3)
7.0
6.5
Engineers India
Neutral
182
-
12,291
1,795
2,611
21.1
22.4
5.9
8.1
30.9
22.5
2.2
2.1
12.9
16.1
5.2
3.4
Financials
Axis Bank
Accumulate
534
580
128,112
32,558
35,843
3.5
3.2
27.8
41.0
19.2
13.0
2.1
1.8
11.4
14.9
-
-
Bank of Baroda
Neutral
168
-
38,698
22,533
26,079
2.4
2.4
12.0
20.9
14.0
8.0
0.9
0.9
6.6
11.0
-
-
Canara Bank
Neutral
367
-
21,909
17,925
20,235
2.0
2.1
18.5
36.5
19.8
10.1
0.8
0.7
3.4
6.2
-
-
Can Fin Homes
Neutral
486
-
6,463
586
741
3.5
3.5
107.8
141.0
4.5
3.5
1.0
0.8
24.1
25.6
-
-
Cholamandalam Inv. &
Neutral
1,287
-
20,110
2,826
3,307
6.3
6.3
53.7
64.6
24.0
19.9
4.1
3.5
18.3
18.9
-
-
Fin. Co.
Dewan Housing Finance Buy
602
712
18,874
2,676
3,383
2.4
2.7
37.4
49.7
16.1
12.1
2.1
1.9
13.8
16.2
-
-
Equitas Holdings
Buy
141
235
4,785
1,125
1,380
9.6
9.8
1.5
6.0
94.0
23.5
2.1
2.0
2.4
8.2
-
-
Federal Bank
Accumulate
110
125
21,535
4,896
5,930
2.8
3.1
5.4
7.6
20.4
14.5
1.7
1.6
8.5
11.0
-
-
Stock Watch
December 08, 2017
Company Name
Reco
CMP
Target
Mkt Cap
Sales ( Čcr )
OPM(%)
EPS (Č)
PER(x)
P/BV(x)
RoE(%)
EV/Sales(x)
(Č)
Price ( Č)
( Č cr )
FY18E FY19E
FY18E
FY19E
FY18E
FY19E
FY18E
FY19E
FY18E
FY19E
FY18E
FY19E
FY18E
FY19E
Financials
GIC Housing
Buy
417
655
2,245
376
477
3.6
3.7
33.0
40.0
12.6
10.4
2.3
1.9
20.0
23.0
-
-
HDFC Bank
Neutral
1,809
-
468,194
55,236
63,253
4.5
4.4
68.9
82.4
26.3
22.0
4.6
3.8
18.7
18.5
-
-
ICICI Bank
Neutral
306
-
196,490
42,361
51,378
3.6
3.9
18.4
25.7
16.7
11.9
1.8
1.8
11.3
15.0
-
-
Karur Vysya Bank
Buy
113
180
8,169
3,289
3,630
3.7
3.9
10.8
14.1
10.5
8.0
1.3
1.1
12.5
14.7
-
-
LIC Housing Finance
Accumulate
562
630
28,339
4,895
6,332
3.4
3.7
50.7
66.8
11.1
8.4
2.2
1.8
21.7
23.8
-
-
Punjab Natl.Bank
Neutral
174
-
36,973
23,708
25,758
2.1
2.1
5.9
16.4
29.6
10.6
0.9
0.8
3.0
8.3
-
-
RBL Bank
Neutral
511
-
21,282
2,309
2,888
2.6
2.5
16.4
19.1
31.2
26.8
3.9
3.5
13.3
13.8
-
-
Repco Home Finance
Buy
619
825
3,874
496
597
4.4
4.2
38.5
48.7
16.1
12.7
2.9
2.4
19.6
20.6
-
-
South Ind.Bank
Neutral
31
-
5,661
3,195
3,567
3.0
3.1
3.0
3.8
10.4
8.2
1.0
0.9
10.5
11.9
-
-
St Bk of India
Neutral
317
-
273,291
105,827
121,056
2.4
2.5
16.1
25.6
19.7
12.4
1.5
1.4
6.6
9.9
-
-
Union Bank
Neutral
158
-
11,467
14,650
16,225
2.3
2.3
23.1
32.5
6.8
4.9
0.5
0.5
7.1
9.2
-
-
Yes Bank
Neutral
311
-
71,341
11,088
13,138
3.0
2.9
84.0
99.3
3.7
3.1
0.6
0.5
16.3
16.8
-
-
FMCG
Akzo Nobel India
Neutral
1,764
-
8,460
3,164
3,607
13.8
13.7
58.6
67.9
30.1
26.0
7.4
6.5
24.5
25.1
2.5
2.2
Asian Paints
Neutral
1,143
-
109,675
17,603
20,615
18.6
18.6
2,128.9
2,543.3
0.5
0.5
11.3
9.5
28.0
28.9
6.0
5.1
Britannia
Neutral
4,917
-
59,035
9,690
11,278
14.8
15.4
84.0
101.0
58.5
48.7
21.3
17.0
40.6
39.0
6.1
5.2
Colgate
Neutral
1,046
-
28,452
4,420
5,074
24.9
25.3
28.6
32.8
36.6
31.9
14.4
11.7
43.8
40.5
6.2
5.3
Dabur India
Neutral
345
-
60,790
8,346
9,344
19.6
19.9
7.8
9.0
44.2
38.3
8.9
8.1
25.2
24.8
6.9
6.1
GlaxoSmith Con*
Neutral
6,145
-
25,843
5,072
5,760
18.2
18.4
176.3
199.2
34.9
30.9
7.4
6.7
21.2
21.7
4.4
3.8
Godrej Consumer
Neutral
994
-
67,721
10,171
11,682
20.8
21.5
21.7
27.1
45.8
36.7
10.3
8.9
22.3
23.4
6.8
5.8
HUL
Neutral
1,292
-
279,683
37,077
41,508
20.3
21.8
5,189.9
6,318.5
0.3
0.2
39.4
33.7
74.8
82.0
7.4
6.6
ITC
Neutral
253
-
308,362
44,588
49,853
37.0
37.3
9.6
11.0
26.4
23.0
6.5
6.2
25.1
27.3
6.4
5.7
Marico
Neutral
310
-
39,956
6,788
7,766
18.5
19.2
7.1
8.5
43.6
36.4
15.3
13.1
36.9
38.0
5.7
5.0
Nestle*
Neutral
7,824
-
75,438
10,083
11,182
20.0
20.9
119.7
141.3
65.4
55.4
230.4
210.6
36.7
39.8
7.2
6.4
Tata Global
Neutral
284
-
17,924
7,121
7,641
11.9
12.3
6.9
8.0
41.2
35.5
2.8
2.6
6.8
7.2
2.3
2.1
Procter & Gamble
Neutral
9,616
-
31,215
3,034
3,579
27.1
27.7
167.7
198.8
57.3
48.4
15.4
13.3
28.8
29.5
9.7
8.1
Hygiene
IT
HCL Tech^
Buy
859
1,014
122,600
50,009
54,608
22.1
22.1
62.8
67.6
13.7
12.7
3.1
2.6
22.4
20.6
2.1
1.8
Infosys
Accumulate
1,000
1,120
229,722
70,333
75,960
26.0
26.0
61.7
65.9
16.2
15.2
3.1
2.8
18.9
18.7
2.7
2.4
TCS
Reduce
2,618
2,442
501,094
123,384
134,488
26.1
26.1
133.2
143.7
19.7
18.2
5.4
5.1
27.6
27.8
3.7
3.4
Tech Mahindra
Accumulate
497
526
48,489
30,545
32,988
15.0
15.0
35.2
37.6
14.1
13.2
2.4
2.2
16.8
16.2
1.4
1.2
Stock Watch
December 08, 2017
Company Name
Reco
CMP
Target
Mkt Cap
Sales ( Čcr )
OPM(%)
EPS (Č)
PER(x)
P/BV(x)
RoE(%)
EV/Sales(x)
(Č)
Price ( Č)
( Č cr )
FY18E FY19E
FY18E
FY19E
FY18E
FY19E
FY18E
FY19E
FY18E
FY19E
FY18E
FY19E
FY18E
FY19E
IT
Wipro
Neutral
281
-
136,924
54,164
56,544
22.3
22.3
18.8
19.5
15.0
14.4
2.4
2.1
15.0
13.6
1.8
1.5
Media
D B Corp
Neutral
354
-
6,506
2,404
2,625
30.5
31.5
23.7
26.9
14.9
13.2
3.5
3.0
23.5
22.8
2.5
2.3
HT Media
Neutral
99
-
2,300
2,589
2,830
15.1
15.4
8.3
10.9
11.9
9.1
1.0
0.9
8.4
10.4
0.4
0.3
Jagran Prakashan
Buy
164
225
5,113
2,541
2,835
28.5
28.7
12.7
14.1
12.9
11.7
2.7
2.3
21.3
21.4
1.9
1.6
Sun TV Network
Neutral
858
-
33,816
3,238
3,789
51.9
55.1
30.9
38.0
27.8
22.6
7.9
7.0
30.0
31.0
10.0
8.4
Hindustan Media
Neutral
242
-
1,778
1,002
1,074
23.3
23.5
29.2
33.8
8.3
7.2
1.3
1.1
15.6
15.4
0.8
0.5
Ventures
TV Today Network
Accumulate
411
435
2,452
667
727
27.7
27.7
18.6
20.1
22.1
20.5
3.4
3.5
15.6
17.3
3.2
3.0
Music Broadcast Limited Accumulate
397
434
2,262
271
317
91.0
109.0
6.0
10.0
66.1
39.7
4.1
3.7
6.5
9.3
7.9
6.5
Metals & Mining
Coal India
Neutral
263
-
163,441
82,301
91,235
17.0
18.0
17.1
20.5
15.4
12.8
2.9
2.7
45.0
55.0
1.7
1.5
Hind. Zinc
Neutral
288
-
121,541
22,108
24,555
57.0
58.0
22.1
26.3
13.0
10.9
4.2
3.4
32.0
35.0
4.5
3.7
Hindalco
Neutral
237
-
53,224
102,350
105,355
13.5
14.5
21.5
24.5
11.0
9.7
1.5
1.3
15.0
15.2
1.1
1.0
JSW Steel
Neutral
250
-
60,467
64,500
68,245
21.1
21.5
20.1
21.2
12.5
11.8
2.3
2.0
-
-
1.7
1.6
NMDC
Neutral
130
-
41,099
10,209
11,450
47.0
48.0
11.1
12.1
11.7
10.7
1.6
1.5
-
-
3.5
3.2
SAIL
Neutral
79
-
32,504
54,100
63,555
3.0
10.0
(10.0)
1.5
52.5
1.1
1.0
-
-
1.6
1.4
Vedanta
Neutral
286
-
106,182
81,206
87,345
28.0
29.0
26.5
33.5
10.8
8.5
2.5
2.1
-
-
2.1
1.8
Tata Steel
Neutral
688
-
66,810
121,445
126,500
16.2
17.2
65.4
81.3
10.5
8.5
1.7
1.4
-
-
1.1
0.9
Oil & Gas
GAIL
Neutral
493
-
83,347
53,115
52,344
14.2
15.3
30.0
31.1
16.4
15.9
2.1
1.9
-
-
1.3
1.3
ONGC
Neutral
177
-
227,277
83,111
84,934
44.2
44.9
16.4
16.9
10.8
10.5
1.3
1.2
-
-
2.6
2.6
Indian Oil Corp
Neutral
392
-
190,109
396,116
432,560
8.5
8.8
40.1
42.2
9.8
9.3
1.7
1.5
-
-
0.6
0.6
Reliance Industries
Neutral
931
-
605,276
257,711
267,438
17.0
18.2
89.1
89.5
10.5
10.4
1.0
0.9
-
-
2.0
1.9
Pharmaceuticals
Alembic Pharma
Buy
516
600
9,718
3,346
3,915
19.6
19.2
21.0
23.9
24.6
21.6
4.3
3.7
19.1
18.4
2.9
2.5
Alkem Laboratories Ltd
Accumulate
2,175
2,287
25,999
6,320
7,341
17.5
19.8
72.7
96.6
29.9
22.5
5.3
4.5
16.7
18.7
4.1
3.4
Aurobindo Pharma
Buy
672
823
39,351
17,086
19,478
22.1
22.0
44.7
51.4
15.0
13.1
3.3
2.7
24.7
22.7
2.4
2.1
Aventis*
Neutral
4,330
-
9,972
2,411
2,698
18.8
18.8
151.6
163.9
28.6
26.4
4.4
3.6
25.4
27.5
3.7
3.1
Cadila Healthcare
Neutral
417
-
42,700
11,365
12,926
20.0
20.0
18.4
20.5
22.7
20.4
5.0
4.1
24.3
22.2
3.8
3.3
Cipla
Sell
593
462
47,686
16,163
18,711
16.6
16.9
20.7
24.3
28.6
24.4
3.4
3.0
12.6
13.1
3.1
2.6
Dr Reddy's
Reduce
2,196
2,040
36,414
13,734
15,548
17.7
20.2
69.9
102.0
31.4
21.5
2.8
2.5
9.2
12.4
2.9
2.5
GSK Pharma*
Sell
2,450
2,000
20,752
2,968
3,324
13.8
15.9
37.8
46.3
64.8
52.9
11.3
12.4
16.7
22.4
6.8
6.2
Indoco Remedies
Sell
265
136
2,444
1,114
1,297
9.9
13.9
5.6
11.4
47.4
23.3
3.6
3.2
7.7
14.5
2.5
2.1
Stock Watch
December 08, 2017
Company Name
Reco
CMP
Target
Mkt Cap
Sales ( Čcr )
OPM(%)
EPS (Č)
PER(x)
P/BV(x)
RoE(%)
EV/Sales(x)
(Č)
Price ( Č)
( Č cr )
FY18E FY19E
FY18E
FY19E
FY18E
FY19E
FY18E
FY19E
FY18E
FY19E
FY18E
FY19E
FY18E
FY19E
Pharmaceuticals
Ipca labs
Accumulate
537
570
6,780
3,256
3,647
14.1
17.1
16.2
25.4
33.2
21.2
2.6
2.3
8.0
11.5
2.1
1.9
Lupin
Buy
819
1,091
37,034
16,240
18,562
21.3
21.7
42.5
49.6
19.3
16.5
2.4
2.1
13.3
13.7
2.4
2.0
Natco Pharma
Accumulate
930
1,057
16,227
1,886
2,016
32.3
29.5
23.2
22.0
40.2
42.2
8.4
7.4
20.9
17.6
8.5
7.9
Sun Pharma
Buy
510
615
122,410
28,312
31,826
20.7
22.4
18.5
22.3
27.6
22.9
3.1
2.8
11.5
14.0
3.9
3.4
Syngene International
Accumulate
537
587
10,747
1,394
1,818
33.0
36.5
15.8
21.0
34.0
25.6
6.3
5.2
18.6
20.3
7.7
5.9
Power
Tata Power
Neutral
91
-
24,573
32,547
33,806
20.5
20.5
4.7
5.4
19.3
17.0
1.8
1.6
10.5
10.5
1.7
1.7
NTPC
Neutral
180
-
148,212
86,070
101,246
28.3
30.7
12.9
16.2
13.9
11.1
1.4
1.3
10.6
12.4
3.1
2.8
Power Grid
Accumulate
202
223
105,861
29,183
32,946
89.7
90.0
18.0
20.8
11.3
9.7
1.9
1.7
17.7
18.2
7.6
7.0
Real Estate
Prestige Estate
Neutral
305
-
11,449
4,607
5,146
21.0
22.2
7.9
9.8
38.7
31.2
2.4
2.2
10.3
12.0
3.7
3.3
MLIFE
Accumulate
460
522
2,362
487
590
12.3
17.8
21.0
31.2
21.9
14.8
1.2
1.1
5.2
7.4
3.6
2.9
Telecom
Bharti Airtel
Neutral
513
-
205,207
97,903
105,233
36.0
36.3
9.3
11.1
55.2
46.5
2.7
2.5
5.0
5.6
3.0
2.8
Idea Cellular
Neutral
98
-
35,190
35,012
37,689
27.1
27.7
(4.4)
(2.7)
1.5
1.6
(6.8)
(4.6)
2.3
2.1
zOthers
Abbott India
Neutral
5,578
-
11,853
3,244
3,723
14.9
16.1
167.5
209.4
33.3
26.6
7.3
6.1
23.7
24.8
3.3
2.8
Asian Granito
Buy
496
570
1,491
1,169
1,286
12.5
12.5
16.0
19.7
31.0
25.1
3.3
2.9
10.7
11.6
1.5
1.3
Bajaj Electricals
Neutral
493
-
5,014
4,646
5,301
6.7
7.6
16.1
22.3
30.6
22.1
5.0
4.3
16.4
19.2
1.1
0.9
Banco Products (India)
Neutral
239
-
1,708
1,530
1,695
13.2
12.7
19.0
20.0
12.6
11.9
2.0
1.8
0.2
0.2
1.0
114.4
Coffee Day Enterprises
Neutral
272
-
5,613
3,494
3,913
17.4
18.0
4.8
5.7
-
47.8
2.4
2.3
-
0.1
2.1
1.8
Ltd
Elecon Engineering
Neutral
92
-
1,035
171
201
15.0
16.2
36.0
43.0
2.6
2.2
0.2
0.2
0.1
0.1
5.4
4.6
Garware Wall Ropes
Neutral
915
-
2,002
928
1,003
15.2
15.2
39.4
43.2
23.2
21.2
3.8
3.3
16.5
15.4
2.0
1.8
Goodyear India*
Neutral
862
-
1,988
1,717
1,866
11.8
12.3
47.9
49.8
18.0
17.3
2.8
2.4
15.6
15.7
0.9
122.3
Hitachi
Neutral
2,505
-
6,812
2,355
2,715
10.3
10.8
49.0
60.9
51.1
41.1
12.0
9.5
0.2
0.2
2.9
2.5
HSIL
Neutral
490
-
3,540
2,240
2,670
14.6
15.0
17.0
22.0
28.8
22.3
2.4
2.3
0.1
0.1
1.8
1.5
Interglobe Aviation
Neutral
1,125
-
43,231
22,570
27,955
14.2
15.0
63.6
81.8
17.7
13.8
9.3
7.9
0.5
0.6
1.6
1.2
Jyothy Laboratories
Neutral
360
-
6,538
1,781
2,044
14.1
15.0
9.4
10.5
38.5
34.3
8.2
7.7
0.2
0.2
3.9
3.3
Linc Pen & Plastics
Neutral
311
-
460
420
462
9.3
9.3
15.3
17.1
20.3
18.2
3.4
3.6
16.9
19.5
1.1
1.0
M M Forgings
Neutral
938
-
1,132
542
642
20.1
21.0
41.6
56.8
22.5
16.5
3.1
2.6
0.1
0.2
2.5
2.2
Mirza International
Neutral
158
-
1,898
1,148
1,285
18.0
18.0
8.0
9.4
19.6
16.9
3.3
2.7
16.3
16.1
1.8
1.6
Navkar Corporation
Buy
184
265
2,765
561
617
41.5
41.5
11.5
12.7
16.0
14.5
1.7
1.5
10.5
10.4
5.6
4.9
Nilkamal
Neutral
1,781
-
2,658
2,317
2,525
11.4
11.1
96.0
105.0
18.6
17.0
3.2
2.7
0.2
0.2
1.1
1.0
Stock Watch
December 08, 2017
Company Name
Reco
CMP
Target Mkt Cap
Sales ( Čcr )
OPM(%)
EPS (Č)
PER(x)
P/BV(x)
RoE(%)
EV/Sales(x)
(Č)
Price ( Č)
( Č cr )
FY18E FY19E FY18E FY19E FY18E FY19E FY18E FY19E FY18E FY19E FY18E FY19E FY18E FY19E
zOthers
Parag Milk Foods
Neutral
248
-
2,083
1,987
2,379
7.6
9.0
12.4
18.3
20.0
13.5
2.8
2.5
8.2
13.2
1.2
1.0
Radico Khaitan
Neutral
285
-
3,796
1,811
1,992
13.2
13.2
8.1
8.8
35.2
32.4
3.6
3.9
10.1
12.0
2.4
2.2
Relaxo Footwears
Neutral
620
-
7,465
1,981
2,310
13.7
14.5
12.0
15.5
51.7
40.0
10.1
8.1
0.2
0.2
3.8
3.3
Siyaram Silk Mills
Accumulate
709
767
3,323
1,769
1,981
12.7
12.7
22.6
26.2
31.3
27.0
4.9
4.2
15.5
15.5
2.1
1.8
Styrolution ABS India* Neutral
1,043
-
1,833
1,800
1,980
8.0
8.1
42.0
46.2
24.8
22.6
2.8
2.5
0.1
0.1
1.1
1.0
Surya Roshni
Neutral
370
-
1,624
4,870
5,320
7.7
7.8
22.8
28.1
16.3
13.2
2.2
1.9
0.1
0.1
0.6
0.5
TVS Srichakra
Neutral
3,303
-
2,529
2,729
2,893
12.7
12.5
248.5
265.0
13.3
12.5
3.8
3.1
0.3
0.3
0.9
0.9
Visaka Industries
Neutral
621
-
986
1,104
1,214
12.1
12.6
31.0
37.9
20.0
16.4
2.4
2.2
0.1
0.1
1.1
1.0
VIP Industries
Accumulate
353
400
4,986
1,450
1,693
10.4
10.5
6.5
7.8
53.9
45.2
11.4
10.0
21.1
22.1
3.4
2.9
Navin Fluorine
Neutral
696
-
3,437
945
1,154
17.5
17.9
28.7
34.8
24.3
20.0
4.0
3.4
-
-
3.2
2.5
Source: Company, Angel Research; Note: *December year end; #September year end; &October year end; Price as on December 07, 2017
Market Outlook
December 08, 2017
Research Team Tel: 022 - 39357800
DISCLAIMER
Angel Broking Private Limited (hereinafter referred to as “Angel”) is a registered Member of National Stock Exchange of India
Limited,Bombay Stock Exchange Limited and Metropolitan Stock Exchange Limited. It is also registered as a Depository Participant with
CDSL and Portfolio Manager with SEBI. It also has registration with AMFI as a Mutual Fund Distributor. Angel Broking Private Limited is a
registered entity with SEBI for Research Analyst in terms of SEBI (Research Analyst) Regulations, 2014 vide registration number
INH000000164. Angel or its associates has not been debarred/ suspended by SEBI or any other regulatory authority for accessing
/dealing in securities Market. Angel or its associates/analyst has not received any compensation / managed or
co-managed public offering of securities of the company covered by Analyst during the past twelve months.
This document is solely for the personal information of the recipient, and must not be singularly used as the basis of any investment
decision. Nothing in this document should be construed as investment or financial advice. Each recipient of this document should make
such investigations as they deem necessary to arrive at an independent evaluation of an investment in the securities of the companies
referred to in this document (including the merits and risks involved), and should consult their own advisors to determine the merits and
risks of such an investment.
Reports based on technical and derivative analysis center on studying charts of a stock's price movement, outstanding positions and
trading volume, as opposed to focusing on a company's fundamentals and, as such, may not match with a report on a company's
fundamentals. Investors are advised to refer the Fundamental and Technical Research Reports available on our website to evaluate the
contrary view, if any.
The information in this document has been printed on the basis of publicly available information, internal data and other reliable
sources believed to be true, but we do not represent that it is accurate or complete and it should not be relied on as such, as this
document is for general guidance only. Angel Broking Pvt. Limited or any of its affiliates/ group companies shall not be in any way
responsible for any loss or damage that may arise to any person from any inadvertent error in the information contained in this report.
Angel Broking Pvt. Limited has not independently verified all the information contained within this document. Accordingly, we cannot
testify, nor make any representation or warranty, express or implied, to the accuracy, contents or data contained within this document.
While Angel Broking Pvt. Limited endeavors to update on a reasonable basis the information discussed in this material, there may be
regulatory, compliance, or other reasons that prevent us from doing so.
This document is being supplied to you solely for your information, and its contents, information or data may not be reproduced,
redistributed or passed on, directly or indirectly.
Neither Angel Broking Pvt. Limited, nor its directors, employees or affiliates shall be liable for any loss or damage that may arise from
or in connection with the use of this information.